Tracking Planes 150 Miles Away on Strict Dorm WiFi
overcoming humidity and client isolation with a Pi Zero 2 W and custom antenna
I built an ADS-B ground station on my dorm balcony–behind restrictive campus WiFi and in Houston heat–using a Pi Zero 2 W, a DIY quarter-wave antenna, and Cloudflare Tunnels and Tailscale. I increased message rate from ~5 to ~750 msg/s, and it now tracks aircraft from Austin to Louisiana.
You can view the live feed in its own tab here.
Motivation
I’ve been wanting to feed data to ADS-B aggregators and get some experience with Raspberry Pis as always-on computers. ADS-B is the system aircraft use to broadcast GPS, altitude, and speed. Aggregators like FlightRadar24 rely on volunteer feeders to collect this 1090 MHz data. I wanted to build a node for that network.
As I decided on what parts to purchase, I kept a few factors in mind:
- The entire setup must be mounted high up. The Martel College 5th-floor balcony was the clear choice.
- The feeder must communicate over WiFi. I could not run an ethernet cable to the balcony. Making things more tricky, the Rice network enforces client isolation, making peer-to-peer connections impossible.
- Cooling and weatherproofing are priorities. Houston is hot, rainy, and humid. High temperatures and moisture can cause the Pi to throttle and the software-defined radio to pick up the wrong frequencies.
- I want it to be small, consume little power, and take up little space.
I also noticed a lack of documentation online explaining why specific design decisions were made, so I wanted to contribute my build process to the community.

Bill of Materials
With that in mind, here’s my bill of materials:
- A 2832U-based Software-defined Radio
I went with the RTL-SDR Blog V4. The V4 runs cooler than the well-known Blog V3. - Raspberry Pi Zero 2 W Kit
The Pi Zero 2 W has low power consumption, leading to less heat. It has WiFi and just one USB-OTG port–that’s all I need! The kit came with a heatsink and USB + HDMI adapters. - CanaKit 5V 2.5A Micro USB Power Supply
A high-quality power adapter is necessary for a project like this. The SDR draws quite a bit of power for a Pi Zero, and stability issues impact reception. I would have liked a power supply that was explicitly weather-resistant, and a longer cord would have been nice. - SanDisk High Endurance MicroSD Card - 32GB
Continuous operation is hard on SD cards. While the software is designed to avoid tons of writing, a high-quality card ought to help with longevity, especially in Houston’s heat. 16GB would have been fine, but the 32GB SKU was only a few bucks more. - 1090 MHz SAW Filter
This filter helps the SDR avoid drowning in environmental noise. By only allowing 1090 MHz frequencies to pass through, it improves the signal-to-noise ratio.
And a few more parts that can vary depending on price and installation details:
- Weather-resistant box
- I went with this one from Amazon, and it ended up being about the right size.
- N-type 4-hole bulkhead
- I made a custom spider-style antenna out of wire and a connector. A wide variety of connectors are often used, such as F-81L or SO-239. I went with an N-type for its superior weather resistance and better handling of high-frequency signals.
- Copper wire
- N-type to SMA cable
Rounding out the list, I used a PVC pipe for mounting the antenna, some wire crimp connectors, and miscellaneous fasteners, glue, etc. I also purchased conformal coating for the Pi, and I plan to apply it soon.
Enclosure Assembly
I started by getting the box ready. My thermal strategy relies on passive convection. Intake and exhaust vents at the bottom and top create a chimney effect to dissipate heat.


I protected both holes with some mesh to keep insects out. The top hole has a PVC elbow connector to prevent water ingress. As Houston heats up, we’ll see how effective this cooling design is. Since airflow was the priority, I wasn’t aiming for an airtight box.
Antenna Construction
There are commercially available 1090 MHz ADS-B antennas. As an electrical engineering student, though, it seemed worthwhile (and cheaper!) to build my own. There are a few designs out there, but most follow a similar pattern with a vertical whip and four radials at 45 degrees.
I calculated the resonant length for the whip and radials. To find the wavelength (λ), we divide the speed of light (c) by the frequency (1090 MHz), giving us a wavelength of 0.275 meters. For a quarter-wave monopole, the resonant length is λ/4, or 68.75 mm.
However, signals travel slower in copper wire than in a vacuum. With this insulated wire, the velocity factor is about 0.95. Applying this factor (68.75 mm × 0.95) reduces the required physical length. Therefore, I cut each wire to about 66 mm.


If the four radials were flat, they would have an impedance of about 35 Ohms. By bending them to 45 degrees, their impedance is about 50 Ohms. This matches the 50 Ohm standard of the coax and SDR, minimizing reflections.
Software
I flashed the Pi with ADSB.im. This feeder image is fairly easy to set up and can simultaneously feed several aggregators. ADS-B signals are decoded using readsb. The map interface is tar1090, and the graphs are from graphs1090.
Initial config on Rice WiFi was a challenge, though. ADSB.im is meant to run headlessly, and config is done via a localhost website. Because Rice’s WiFi does not support peer-to-peer connections, I set it up by first connecting both the Pi and my laptop to my phone’s hotspot, but I needed a better strategy for long-term use.
The solution was Tailscale; I treat the Pi as a node on a private mesh network. Since I cannot SSH locally (due to client isolation), I SSH over the Tailscale interface. This allows me to update configurations or view the raw tar1090 interface securely from my laptop anywhere in the world, without exposing port 22 to the open web. I initially attempted to use Tailscale Funnels for public access to keep things simple. However, I found the performance on the Pi Zero to be sluggish–it just couldn’t handle more than a few requests at once.
For the public facing map, I decided to use Cloudflare. I run the cloudflared daemon directly on the Pi, creating an outbound connection. Cloudflare’s excellent caching increases speed and reduces load on the Pi and the Rice network. I had to set up caching to only save static assets (like map tiles and UI details), but it was just a few clicks. Cloudflare made it easy to enable HTTPS, and the DDoS protection is not crucial but very cool.
At 2.4 GHz, the WiFi range is decent. Stability is not perfect; it loses connection occasionally. Still, its uptime is around 99.5%. That sounds great to me.

The Pi Zero 2 W struggles to feed many aggregators, and multilateration (a method to locate an aircraft even if it does not broadcast its location) tends to have issues. The slower CPU contributes, but I expect the main culprit is network jitter and latency caused by WiFi and tunneling.
This was a compromise I was willing to make in order to have the Zero 2 W’s low heat generation. Right now, I’m feeding data to:
Oh, and feeding data gets me free access to the business plans on paid aggregators, giving me access to detailed data from around the globe.
Installation
I attached the antenna to a cable gland, which I then attached to a 5’ PVC pipe. I mounted the box and pipe to the balcony’s railing.


Because the Pi power cord has a large ferrite core toward the end, I didn’t have as much slack inside the box as I would’ve liked. Fitting components in required a bit of force, and I’d improve this in a second iteration. Ultimately, it works just fine. I could see better placement helping with heat dissipation; we’ll see later if that’s needed.
Performance
I initially tested the feeder with the stock 20 cm dipole on the first floor of a brick building. Performance was poor, as expected, but it gave me a great baseline. ADS-B signals are mostly line-of-sight, and the dipole’s length wasn’t doing me any favors.
Later, I installed the antenna and relocated the feeder to a 5th-floor balcony. You can see this change happened Saturday at noon in the following graphs.

Message rate is one of the most important measures of an ADS-B feeder’s performance. It refers to how often the feeder “hears” a message sent from an aircraft.
With the old antenna and location, I was lucky to see over 5 messages per second. After relocating and upgrading the antenna, I saw as high as 750–over two orders of magnitude greater! I am writing this after the January 2026 North American winter storm, and it seems air traffic numbers are still returning to typical levels.

I also like keeping track of the actual number of aircraft tracked. It’s seen up to ~130 at once, and it’s clear that air traffic volume follows daily patterns.


These two graphs above might be my favorite of the bunch because the difference between antennas/locations is so stark. RSSI (signal strength) has increased across the board. The strongest signals are as high as -1.5 dB, and the noise floor hasn’t appreciably increased. The -1.5 dB peaks suggest the SDR is clipping. While readsb’s autogain is enabled, the V4’s LNA might be too aggressive for the new antenna. I likely need to manually reduce gain.
Range has also clearly skyrocketed, and I’ve been able to occasionally see aircraft past Austin!

Houston is still quite cold, but it’s great to see the CPU stay under 50 degrees C. I had to enable ZRAM memory compression to improve stability. It’s sitting around 25% CPU utilization. It’s only using about 4 GB of space on the MicroSD card.
Data Analysis
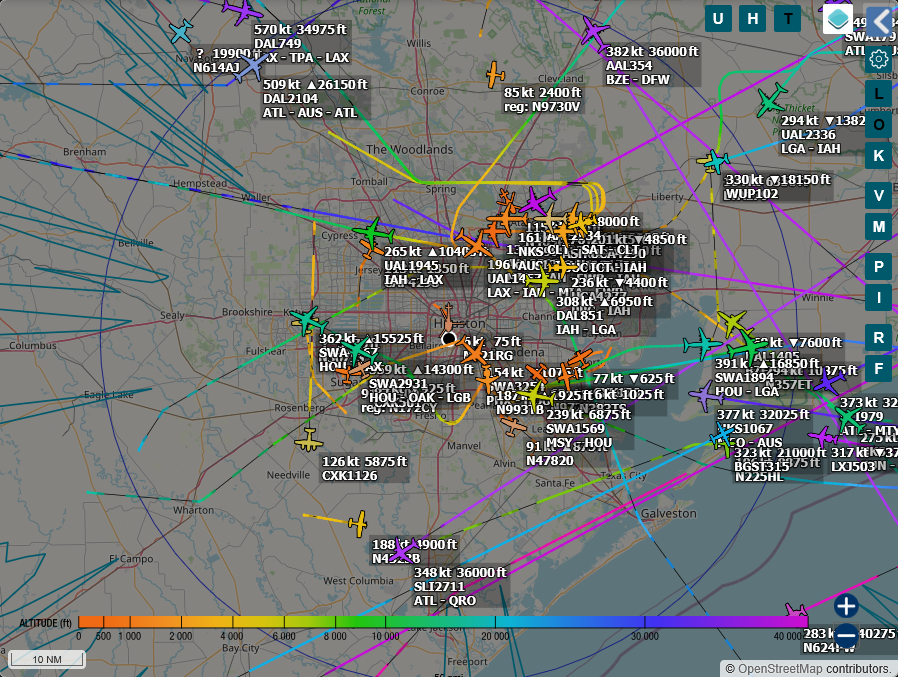
Now that I’ve run the feeder for a while, I have some data to play with! I especially enjoy the heatmap view. Each dot represents one received message. Cooler colors (blues/purples) represent higher altitudes.

This is too much information to view at once. Luckily, it’s easy to filter. Let’s start by looking at flights at certain altitudes. Under 350’, we see mainly helicopters and airplanes landing at IAH, Hobby, Pearland, and a number of smaller airports I didn’t even know about.

Filtering for military aircraft reveals more than I expected. There are plenty of small transport crafts, but I’ve also seen tons of NASA T-38s, a C-17, and a CC-330 Husky registered to the Royal Canadian Air Force.


Displaying the Info
I recently found a 10.5” 1080p monitor for free in Rice’s OEDK. I’ve been looking for a project to use it in, and this was the perfect chance. I hooked up a Raspberry Pi 4 running Chromium in Kiosk Mode, wrote a few autostart scripts, and now the student club Rice Flight has a live view of nearby aircraft! The system restarts every night and reloads the website every three hours. It also auto-selects the nearest aircraft and displays a picture of it if available.


Conclusion
Despite weather and WiFi challenges, the node has been running reliably. I’m very happy with overall performance, and I learned a ton from the process. I’ll continue monitoring thermal performance as summer approaches, but for now, I’m thrilled with the results. I’d like to thank Ian Hsieh for his help.
You can find historical performance data here.